Power BI Implementation Planning: Comprehensive Guide
Plan your Microsoft Power BI implementation for accurate, actionable dashboards. Learn how to deploy, secure, and scale reporting effectively. Get started now.

Want to make your Microsoft 365 work harder for your business?
and we’ll tailor a solution that’s just right for you.
Power BI doesn’t drive change on its own. In fact, most organisations, around 9 out of 10, are still developing their BI and analytics capabilities, struggling to move beyond basic reporting to truly data-driven decisions.
Success requires alignment. Tools, teams, and data must work toward shared goals; otherwise, BI risks becoming just another underused piece of software. A strategic rollout connects people, processes, and data to ensure insights lead to action.
This guide explores what a successful rollout really involves. Whether you’re launching Power BI for the first time or fixing a fragmented setup, you’ll learn how to build secure, scalable reporting that delivers clarity.
Essential Highlights:
- Evaluate Stakeholder Readiness: Check if teams are equipped and comfortable with new reporting responsibilities before starting dashboards.
- Set Clear Success Metrics: Define measurable outcomes beyond just data availability, like decision speed or error reduction.
- Plan Maintenance Routines: Schedule regular reviews of reports, data flows, and dashboard relevance to keep insights actionable.
- Establish Communication Channels: Create direct lines for feedback, issue reporting, and knowledge sharing across teams.
- Document Processes Thoroughly: Keep clear records of data sources, transformations, and dashboard logic for future audits and scalability.
End-to-End Power BI Implementation Explained
Power BI unifies data from multiple sources into interactive dashboards and visuals that turn insight into action. A strong rollout ensures your reports reflect how the business truly operates, linking data, people, and goals through clear, accessible information.
A full Power BI setup usually includes four main parts working together:
- Power BI Desktop for designing models and visual reports.
- Power BI Service for publishing and sharing them securely.
- Power BI Mobile for monitoring metrics on the go.
- Power BI Gateway to connect live data from internal systems.

For product or customer-facing platforms, Power BI Embedded lets you integrate these visuals directly into your apps or web portals. Once you see how all the pieces fit together, it’s easier to plan how Power BI can truly serve your business.
Power BI Success Starts with Structured Planning
Rushing into deployment often creates confusion and delays. Teams can struggle to trust reports when systems aren’t set up carefully, and resolving issues later takes far more time. Planning first gives the rollout direction and prevents these problems.
Here’s how structured planning strengthens a Power BI implementation:
- Reliable results: Data is prepared and validated so insights are accurate from day one.
- Smooth rollout: Proper sequencing of setup steps reduces rework and keeps dashboards functional quickly.
- Secure handling: Early definition of permissions and controls protects sensitive information.
- Built for expansion: Systems are configured to handle new data sources, users, and evolving business needs.
Taking these steps early makes the deployment process more predictable and ensures reports are dependable for everyday business decisions.
Also Read: 7 Proven Benefits of Custom Software for Businesses in 2025
With the groundwork laid, the implementation steps turn strategy into actionable, reliable dashboards.
Step-by-Step Guide to Power BI Implementation
The following steps outline practical, hands-on instructions for a successful Power BI rollout. Each phase comes with tasks, checklists, and tips to help teams execute smoothly.
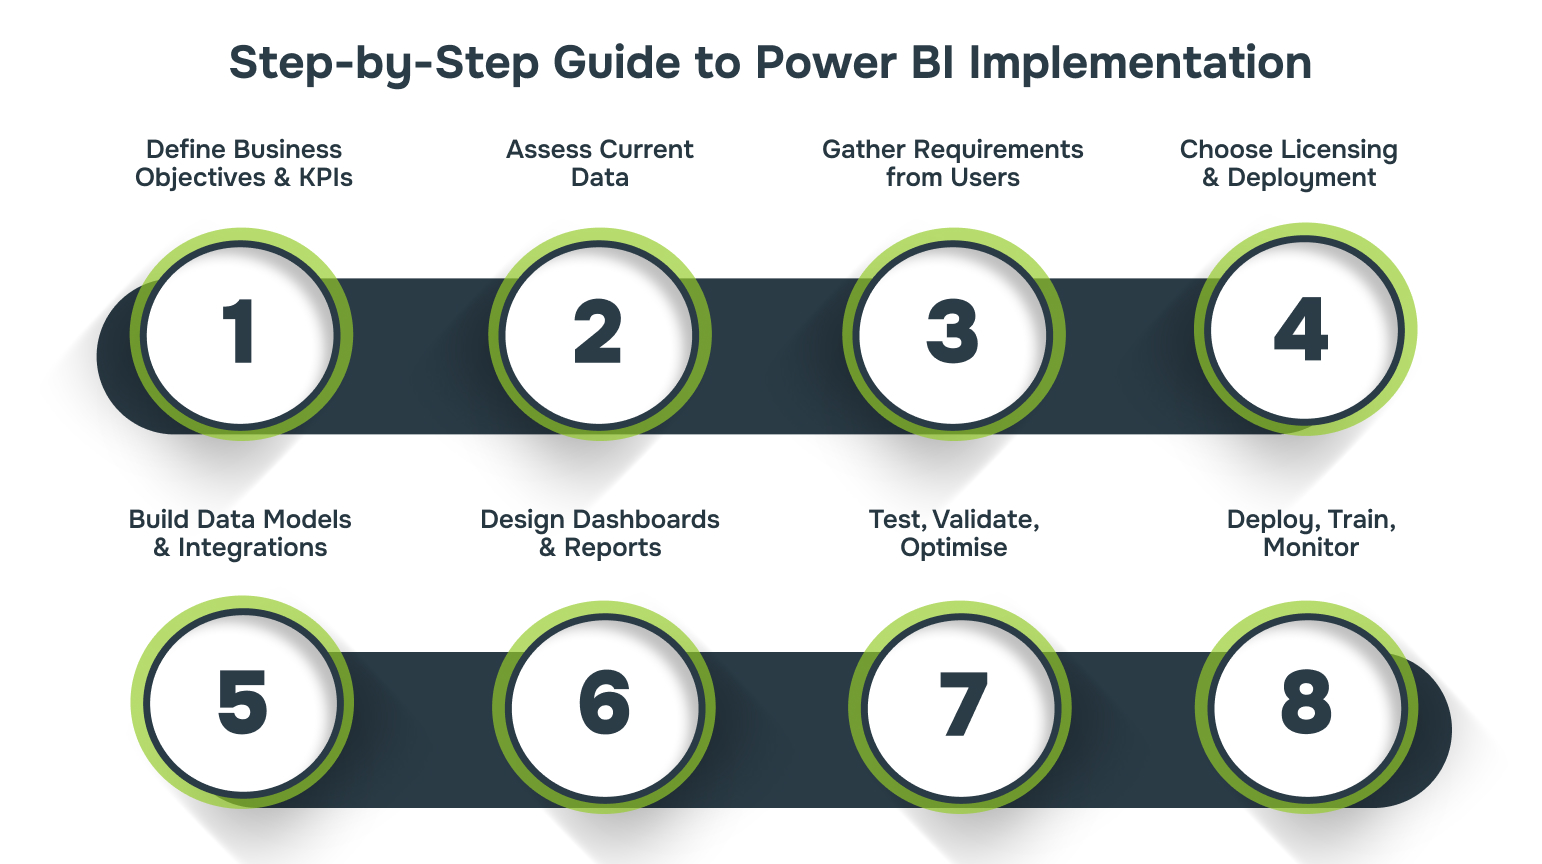
Phase 1: Define Business Objectives & KPIs
Goal: Ensure your Power BI implementation aligns with business priorities.
Tasks:
- Map strategic goals to KPIs using a “business outcome first” approach:
- Example: Revenue Growth → Sales per Region → Power BI dashboard showing regional trends and forecast variance.
- Validate KPIs with executives, finance, and operations to ensure alignment and feasibility.
- Categorise KPIs: Operational, Tactical, Strategic. It helps prioritise dashboards.
Checklist:
- Top 3-5 business goals clearly defined
- KPIs aligned to goals and measurable
- Stakeholder approval documented
Tip: Focus on impactful metrics first; avoid creating dashboards for everything.
Phase 2: Assess Current Data
Goal: Understand data readiness and integration requirements.
Tasks:
- Inventory all data sources (ERP, CRM, spreadsheets, databases).
- Assess data quality: completeness, accuracy, consistency.
- Map data lineage to understand source-to-report flow.
- Identify gaps and integration needs.
Checklist:
- Data sources catalogued
- Data quality issues noted
- Integration requirements documented
Tip: Use a simple spreadsheet to track sources, refresh frequency, and owner for each dataset.
Phase 3: Gather Requirements from Users
Goal: Capture technical and user needs for dashboards and reports.
Tasks:
- Conduct interviews or workshops with key users (executives, analysts, operations).
- Document reporting requirements: desired visuals, drill-downs, and refresh schedule.
- Define user personas to guide design: role, data needs, preferred format.
- Prioritise requirements (must-have vs. nice-to-have).
Checklist:
- Interviews/workshops completed
- Requirements documented per persona
- Prioritised requirement list approved
Tip: Include users early to improve adoption and relevance.
Phase 4: Choose Licensing & Deployment
Goal: Select the right Licensing model and deployment strategy.
Tasks:
- Decide Licensing model:
- Pro (small teams), Premium (enterprise-grade, AI features, dedicated capacity), Embedded (customer-facing apps).
- Define deployment architecture:
- Cloud-first (Power BI Service) vs. on-prem (Report Server)
- Hybrid if compliance requires sensitive data on-prem.
- Plan workspace structure, security roles, and lifecycle management.
Checklist:
- Licensing selected and budgeted
- Deployment model confirmed
- Security and governance policies defined
Tip: For large organisations, Premium offers dedicated capacity and advanced features.
Phase 5: Build Data Models & Integrations
Goal: Create clean, reliable, and efficient data models.
Tasks:
- Clean and transform data using Power Query.
- Build relationships using a star or snowflake schema.
- Standardise calculations with DAX measures.
- Test data connections and refresh schedules.
Checklist:
- Data cleaned and validated
- Relationships properly defined
- Measures standardised
- Refresh schedule tested
Tip: Document data model logic for future maintenance.
Phase 6: Design Dashboards & Reports
Goal: Provide actionable insights in an intuitive format.
Tasks:
- Map KPIs to visuals (charts, tables, maps).
- Customise dashboards by user persona (executive vs. analyst).
- Add interactive features: filters, slicers, drill-throughs.
- Use consistent colour schemes and labels for clarity.
Checklist:
- Dashboards match user requirements
- Interactive elements implemented
- Consistent visual style applied
Tip: Keep dashboards simple. Users should get insights at a glance.

Phase 7: Test, Validate, Optimise
Goal: Ensure dashboards are correct, fast, and trusted.
Tasks:
- Validate all numbers against source systems.
- Stress-test refresh cycles, large datasets, and concurrent users.
- Optimise DAX, query folding, and visual rendering.
- Conduct User Acceptance Testing (UAT) with key personas.
Checklist:
- Data accuracy confirmed
- Performance tested
- Users validated dashboards
Tip: Prioritise validating high-impact KPIs and frequently used dashboards first, and document any anomalies or exceptions for future audits.
Phase 8: Deploy, Train, Monitor
Goal: Drive adoption and continuous improvement.
Tasks:
- Roll out dashboards in phases to selected users.
- Provide role-specific training and documentation.
- Monitor adoption metrics and refresh logs.
- Gather user feedback for iterative improvements.
Checklist:
- Deployment plan executed
- Training completed
- Monitoring in place
- Feedback collected and acted on
Tip: Track adoption metrics and schedule feedback sessions after major releases to ensure dashboards stay relevant.
Also Read: Managed IT Services: Types, Benefits & Challenges
With a structured implementation in place, managing data, security, and access becomes more seamless and reliable.
Data Governance, Security, and Access Management
Power BI works best when you know who can do what from the start. Clear roles keep the right people in control, sensitive info safe, and reports dependable. Getting these basics right makes everything else run smoother. Here’s how it breaks down:
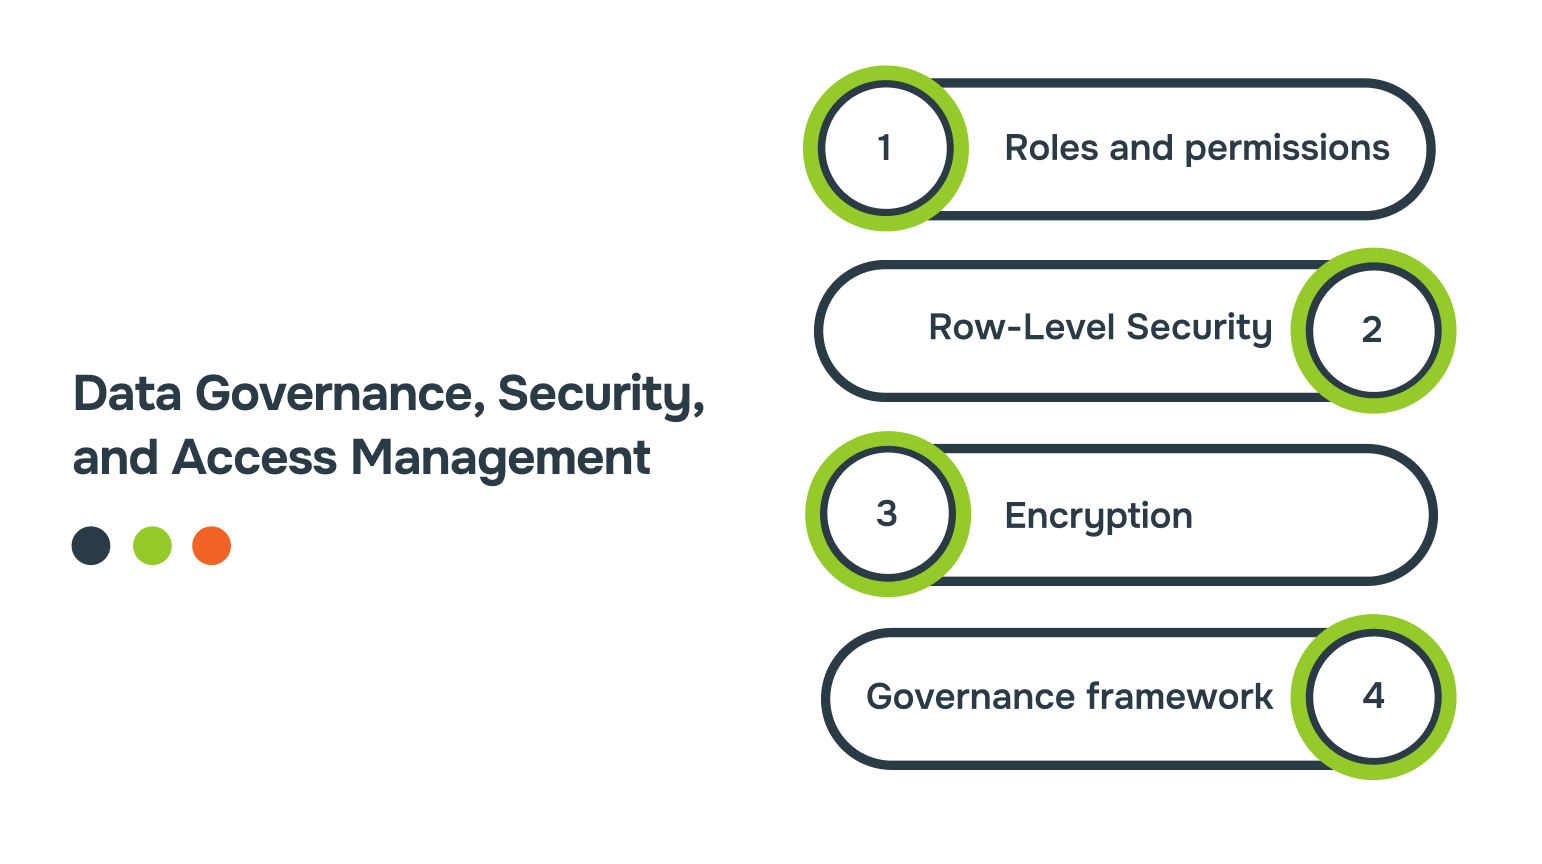
- Roles and permissions: Set them early so users only see what matters to them. This avoids mistakes and keeps data in the right hands.
- Row-Level Security (RLS): Limit data access at the row level. Everyone sees only what’s relevant to their role, keeping insights accurate and private.
- Encryption: Protect data while it’s stored or moving between systems. This makes sure sensitive info stays secure and compliant.
- Governance framework: Assign content owners, control versions, and follow consistent naming. This keeps reports organised and makes scaling up easier.
Laying a solid foundation for governance and security ensures your Power BI environment runs reliably, making it easier to address operational challenges as they arise.
Challenges in Power BI Deployment and Practical Fixes
Even with the right tools and planning, Power BI deployments can hit practical bumps that slow adoption or reduce trust in insights. Issues can appear in reports, dashboards, security, or version handling. Each challenge has a clear fix if identified early.
Let’s look at them side by side to see what causes trouble and how to address it effectively.
| Challenge | Why it Happens | Practical Fix |
| Poor Data Quality | Data coming from multiple sources can be inconsistent or inaccurate | Set up validation rules and regular data cleansing. Automate checks where possible. |
| Slow Report Performance | Overly complex models and heavy calculations make dashboards sluggish | Remove unnecessary columns, optimise calculations, and aggregate data at the source. |
| Security Misconfigurations | Incorrect permissions can expose sensitive data | Review roles regularly and apply row-level security to control access. |
| Low User Adoption | Users may find reports confusing or irrelevant | Involve end-users in design and provide hands-on training for clarity. |
| Version Control Issues | Multiple versions of the same report create confusion | Use version tracking and deployment pipelines to keep reports consistent. |
| Overcomplicated Dashboards | Too many visuals or metrics can overwhelm users | Focus on key insights, simplify layouts, and maintain clear labelling. |
Also Read: Business Process Optimisation: Step-by-Step Guide
With these common deployment hurdles addressed, Alberon can help connect Power BI seamlessly to your existing systems.
Connecting Power BI to Your Existing Systems with Alberon
Power BI is only as useful as the data it sees. If your dashboards aren’t connected to all your systems, reports can be incomplete and slow to update. That makes decisions harder and leaves teams frustrated.
With Alberon, you can make sure your Power BI dashboards reflect real operations using the Microsoft Power Platform, without adding more manual work.
Here’s how it works in practice:
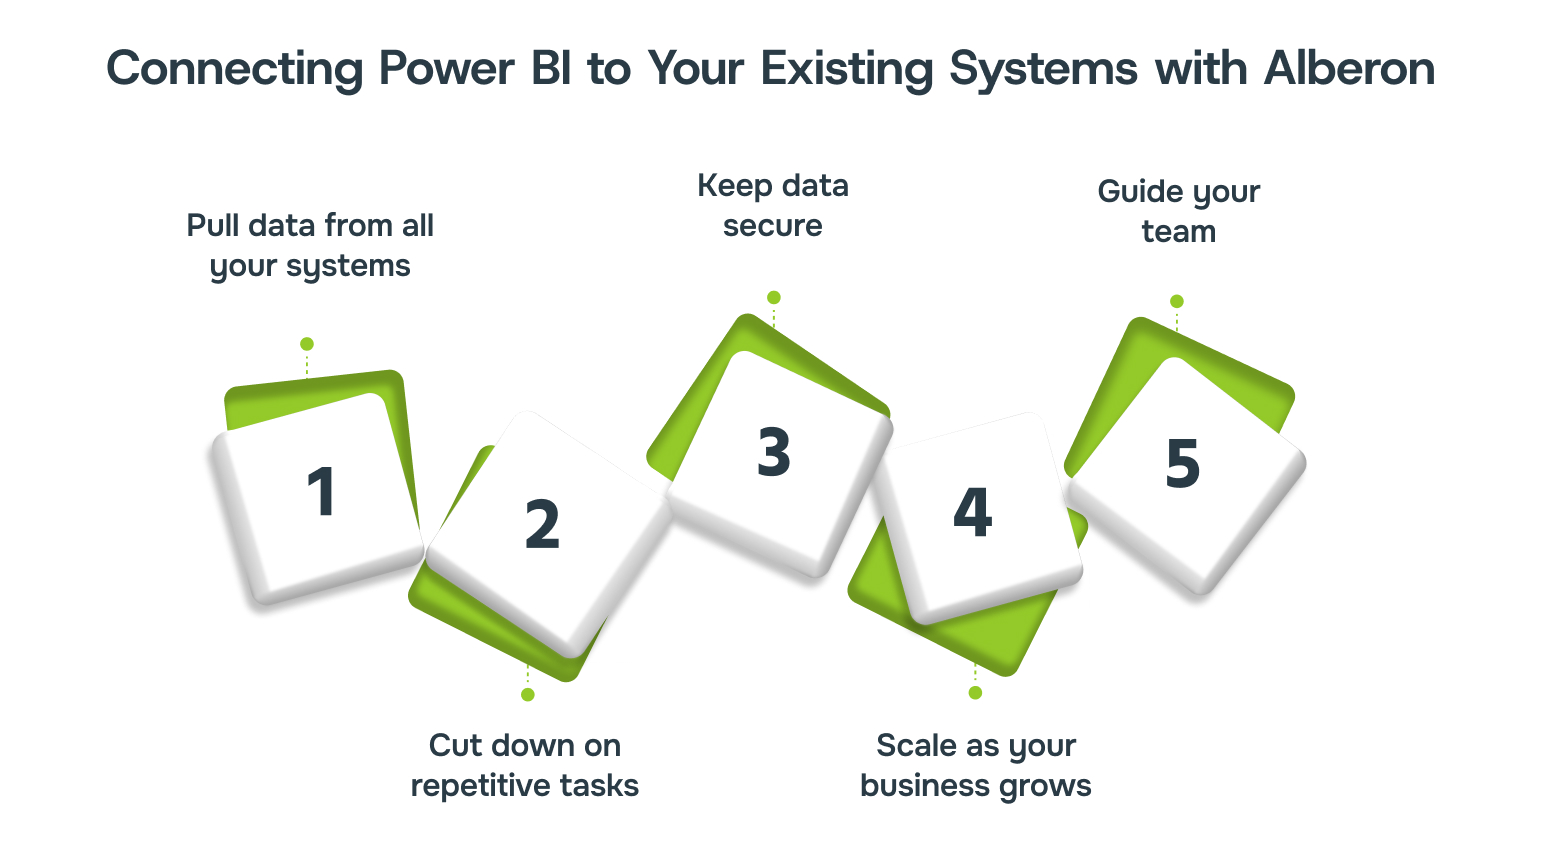
- Pull data from all your systems: Connect dashboards directly to the platforms your teams already use for a complete view of operations.
- Cut down on repetitive tasks: Automate data flow so you spend less time fixing errors and more time using insights.
- Keep data secure: Control access, encrypt sensitive information, and track activity without slowing workflows.
- Scale as your business grows: Systems expand with you, so you don’t need to rebuild when new tools or teams are added.
- Guide your team: Learn the setup, monitor adoption, and make sure everyone can work confidently with the dashboards.
This approach turns Power BI from a reporting tool into a core part of your day-to-day operations, helping you make decisions faster and with accurate data.
Conclusion
Power BI works best when every step of implementation is intentional and aligned with real business needs. Planning, governance, and careful deployment help dashboards stay accurate, accessible, and meaningful. Addressing practical challenges early ensures insights remain actionable and trusted across teams.
Partnering with Alberon adds an extra layer of confidence. You can connect dashboards to your systems, keep data secure, and scale reporting as your business evolves, making insights a reliable part of everyday decision-making.
Contact Alberon today to connect your systems, secure your data, and scale your Power BI dashboards confidently.
FAQs
Q: Can Power BI integrate with non-Microsoft tools?
A: Power BI can connect to a wide range of third-party platforms and databases, letting you bring external data into your dashboards without relying solely on Microsoft products.
Q: How does Power BI handle real-time data streaming?
A: Power BI can visualise live data using streaming datasets or push datasets, allowing dashboards to update instantly as new information comes in from sensors, APIs, or other live sources.
Q: Are there performance differences between cloud and on-prem Power BI setups?
A: Yes, cloud deployments typically offer faster refresh cycles and automatic scaling. On-prem setups give you more control over infrastructure but may need manual tuning to maintain speed.
Q: How does Power BI support collaboration across teams?
A: Power BI allows shared workspaces, commenting, and co-authoring on dashboards, making it easier for multiple teams to analyse and discuss data without exporting reports or creating separate copies.
Ready to Improve your Business Productivity
Get a trusted partner to navigate your digital transformation. With Alberon, you can ensure a smooth transition, clear communication, and peace of mind.